'%20role='img'%20aria-label='Digital%20Dust%20Library'%3e%3cpath%20d='M%2094%2040%20V%2080%20A%2014%2014%200%200%201%2080%2094%20H%2020%20A%2014%2014%200%200%201%206%2080%20V%2020%20A%2014%2014%200%200%201%2020%206%20H%2060'%20stroke='currentColor'%20stroke-width='5'%20stroke-linecap='round'%20stroke-linejoin='round'%3e%3c/path%3e%3crect%20x='22'%20y='32'%20width='13'%20height='46'%20rx='4'%20stroke='currentColor'%20stroke-width='5'%20stroke-linejoin='round'%3e%3c/rect%3e%3crect%20x='38'%20y='40'%20width='13'%20height='38'%20rx='4'%20stroke='currentColor'%20stroke-width='5'%20stroke-linejoin='round'%3e%3c/rect%3e%3crect%20x='54'%20y='50'%20width='12'%20height='28'%20rx='4'%20stroke='currentColor'%20stroke-width='5'%20stroke-linejoin='round'%3e%3c/rect%3e%3cpath%20d='M25%2070%20H32%20M41%2070%20H48%20M57%2070%20H63'%20stroke='currentColor'%20stroke-width='4'%20stroke-linecap='round'%3e%3c/path%3e%3crect%20x='59'%20y='40'%20width='6'%20height='6'%20rx='1.2'%20stroke='currentColor'%20stroke-width='2.4'%3e%3c/rect%3e%3crect%20x='66'%20y='42'%20width='5'%20height='5'%20rx='1'%20fill='currentColor'%3e%3c/rect%3e%3crect%20x='64'%20y='31'%20width='5'%20height='5'%20rx='1'%20stroke='currentColor'%20stroke-width='2.2'%3e%3c/rect%3e%3crect%20x='73'%20y='35'%20width='5'%20height='5'%20rx='1'%20fill='currentColor'%3e%3c/rect%3e%3crect%20x='70'%20y='25'%20width='4'%20height='4'%20rx='1'%20stroke='currentColor'%20stroke-width='2'%3e%3c/rect%3e%3crect%20x='79'%20y='29'%20width='4'%20height='4'%20rx='1'%20fill='currentColor'%3e%3c/rect%3e%3crect%20x='76'%20y='19'%20width='4'%20height='4'%20rx='1'%20stroke='currentColor'%20stroke-width='2'%3e%3c/rect%3e%3crect%20x='85'%20y='23'%20width='3.4'%20height='3.4'%20rx='0.9'%20fill='currentColor'%3e%3c/rect%3e%3crect%20x='82'%20y='14'%20width='3.4'%20height='3.4'%20rx='0.9'%20stroke='currentColor'%20stroke-width='1.8'%3e%3c/rect%3e%3crect%20x='89'%20y='17'%20width='3'%20height='3'%20rx='0.8'%20fill='currentColor'%3e%3c/rect%3e%3crect%20x='74'%20y='12'%20width='3'%20height='3'%20rx='0.8'%20fill='currentColor'%3e%3c/rect%3e%3crect%20x='90'%20y='10'%20width='2.4'%20height='2.4'%20rx='0.7'%20stroke='currentColor'%20stroke-width='1.6'%3e%3c/rect%3e%3crect%20x='80'%20y='8'%20width='2.4'%20height='2.4'%20rx='0.7'%20fill='currentColor'%3e%3c/rect%3e%3c/svg%3e)
Why One Document Is Worth Your Time
In Part 4 we built a portfolio from funds. Now comes the question every investor meets: how do I know what is inside a fund, and what does it really cost? The answer sits in the fund's own documents, and most of them are free and public. Reading them is a skill, and it is easier than it looks, because they all ask the same questions in a similar order.
Quick dictionary
WordMeaning in plain EnglishFactsheetA short summary of a fund, usually one to four pages, updated every month or quarter.KIDKey Information Document: a short, standard document that the EU requires for packaged investment products.ProspectusThe long legal document that describes the fund in full.Ongoing charge (OCF) / TERThe yearly running cost of the fund, shown as a percentage of your money in it.NAVNet asset value: what all the fund's holdings are worth, divided by the number of fund shares.Tracking differenceHow far the fund's return is from its index's return over a period.Tracking errorHow much that gap moves up and down from period to period.Bid-ask spreadThe gap between the price you pay to buy and the price you get when you sell.Premium / discountWhen an ETF's market price is above (premium) or below (discount) its NAV.Risk indicator (SRI)A number on a scale of 1 (lowest risk) to 7 (highest risk) used in the KID.ReplicationHow the fund copies its index: by owning the shares (physical) or through swaps (synthetic).
Three Documents, Three Jobs
Funds publish several documents, and each has a different job. Mixing them up is the first beginner mistake.
1) The factsheet is a summary, and often a marketing document. For example, the Vanguard factsheet for a high dividend fund says at the top: "This is a marketing communication". It also tells readers to look at the prospectus and the KID before they decide [Vanguard factsheet]. Use it to see what a fund holds. Do not use it as the only reason to buy.
2) The KID is the standard document for retail investors in the EU. The European Commission says KIDs "should be a maximum of 3 pages". They must show the product name and producer, who the product is for, a risk and reward profile with "a summary risk indicator", the possible maximum loss, performance scenarios, the costs, and how to complain [European Commission]. The risk indicator "ranges from 1 (lowest risk) to 7 (highest risk)". Performance scenarios must be shown net of costs, and they include favourable, moderate, unfavourable, and stress cases [ESMA]. Some providers still publish a similar document called "Key Investor Information". Vanguard's All-World document is one example, and it states a recommended investment horizon of at least 5 years [Vanguard KII]. Check which document your fund offers.
3) The prospectus and the shareholder report are the long documents. In the US, the SEC describes the prospectus fee table, and the shareholder report with its expense example, performance, the number of holdings, and a chart of what the fund owns [SEC, Prospectus], [SEC, Shareholder Report]. You will not read them in full every year, but open them when something in the short document looks strange.
Rules and names differ by country, so look for the equivalent in yours. The skill is the same everywhere.
The Factsheet, Line by Line
Here are the fields of a real factsheet, the Vanguard FTSE All-World High Dividend Yield UCITS ETF (USD) Accumulating, dated 31 August 2026 [Vanguard factsheet]. We use it only as an example. For each field you get the meaning and a question to ask.
1) Name, share class, ISIN, currency. The factsheet shows the ISIN IE00BK5BR626, the base currency (USD), and that dividends are accumulated, which means they are reinvested inside the fund. Ask: is this exactly the fund and share class my broker shows? Remember from Part 2 that the ISIN is the safe way to check.
2) Ongoing charge. This fund shows 0.29%. This is the yearly running cost. The cost page of justETF says the TER covers management, custody, licence, and distribution costs. It does not cover swap fees, securities-lending income, trading costs inside the fund, or the fees you pay your broker [justETF]. Ask: what else could I pay that this number does not show?
3) Index and how the fund copies it. The index is the FTSE All-World High Dividend Yield Index. The fund buys the shares directly (physical) and uses a "representative sample" of the index. It holds 2,364 stocks, while its benchmark has 2,428. Ask: does the fund hold the index, or a sample, or use swaps? Part 2 explains why this matters.
4) Top holdings. The top 10 companies are 11.4% of the fund, led by JPMorgan Chase at 2.2%. Ask: how much depends on a few names? A low top-10 share means spread, and a high one means concentration.
5) Sector and country weights. Financials are 30.4% of this fund and the United States is 40.1%. Ask: does the mix match the name? A "world" fund that is 40% one country is still diversified, but it is not equal-weight.
6) Size, age, and domicile. The fund has USD 14,834 million in total, and the share class has USD 3,426 million. It started on 24 September 2019 and is Irish-domiciled and a UCITS. Ask: is it big enough to stay open, and does the domicile match my tax logic from Part 4? A small or very new fund can be closed by its provider.
7) Performance versus the benchmark. Over one year, the fund returned 25.59% against 25.55% for the benchmark. Over five years, the annualised numbers are 11.97% and 11.89%. Returns are shown net of fees. Ask: is the gap small, and which way does it go? There is no ten-year figure, because the fund is younger than ten years. Also remember: "past performance is no guarantee of future results" [SEC, Prospectus].
8) Risk indicator and the KID. The factsheet shows a summary risk indicator, and refers to the KID for the official risk and cost details. Ask: does the KID's number match how much loss I said I could accept in Part 4?
Costs: Small Numbers, Big Effects
A cost of 0.25% or 1% sounds tiny. The SEC shows why it is not. In its example, $100,000 grows 4% a year for 20 years, and the fee is taken each year. With a 0.25% fee, you end up with about $208,000. With 0.50%, about $198,000. With 1.00%, about $179,000 [SEC, Fees and Expenses].
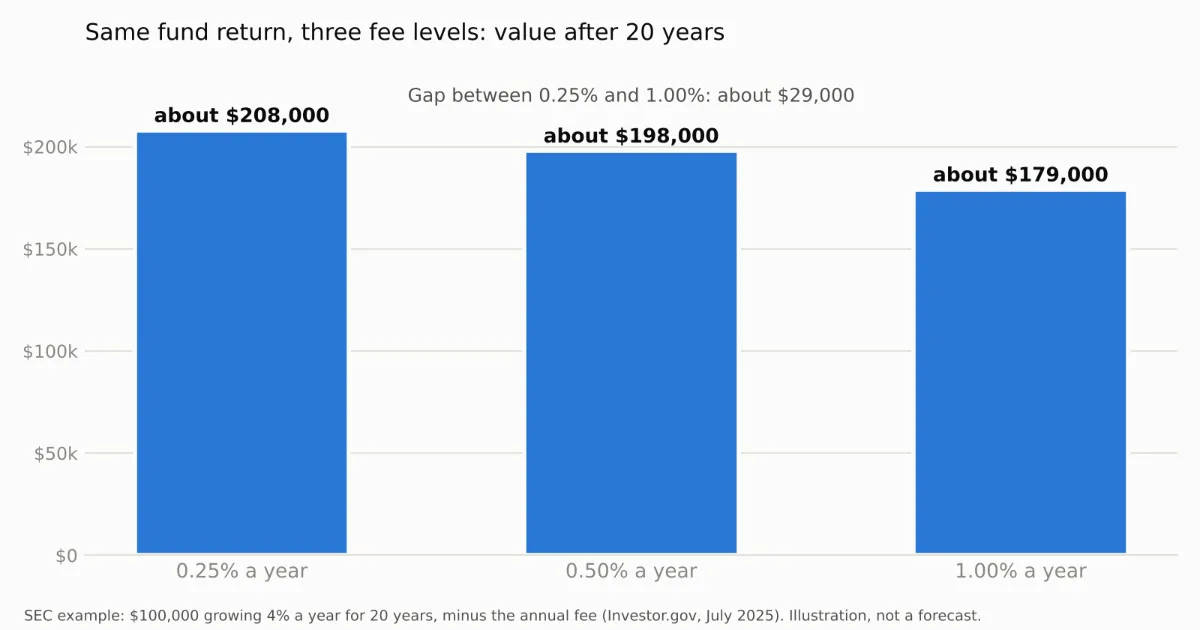
Chart 1: the same fund return, three fee levels, after 20 years (SEC example).
Two more points from the SEC. First, "a fund with higher costs must perform better than a lower-cost fund to generate the same returns for you". Second, the fee table does not show brokerage commissions or other fees from intermediaries, and a flat commission "is often structured as a flat fee charged every time an investor trades", so it costs more, in relative terms, on small trades [SEC, Mutual Fund and ETF Fees]. That is one reason to buy less often and in bigger steps, if your plan allows it.
Tracking Difference: Does the Fund Follow Its Index?
An index fund promises to follow an index, minus costs. Tracking difference is how far it actually is from the index. justETF defines it as the gap between the ETF's return and the index's return, and says it captures the fund's internal costs. In its words, the gap "is effectively your TCO plus the external investor costs", where TCO means total cost of ownership [justETF]. Tracking error is a different thing: a statistical measure, the standard deviation, of how much that gap fluctuates [justETF, in German]. A fund can have a small, steady gap, or a small average gap that jumps around.
Some factsheets do not print a tracking figure, and the two used in this article do not. Then you can calculate your own from the performance table: fund return minus index return. Here is a real example. The Invesco S&P 500 UCITS ETF Acc is a swap-based fund (Part 2). Its factsheet shows calendar-year returns for the ETF and the index [Invesco factsheet]. I subtracted the index return from the ETF return for each year from 2016 to 2025.
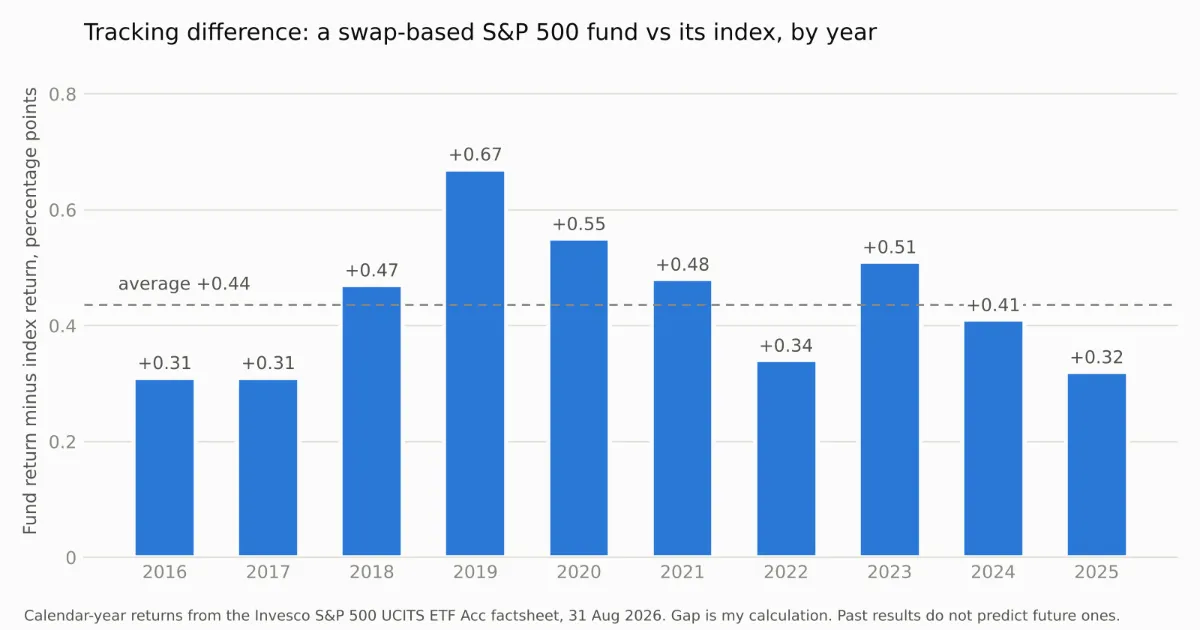
Chart 2: fund return minus index return, by calendar year (my calculation from the factsheet).
Notice what happens: the fund finished slightly above its index in every one of the ten years, by 0.31 to 0.67 percentage points, and by 0.44 on average. You might expect a fund with a charge of 0.05% to finish slightly below its index, so this is worth noticing. The factsheet states a swap fee of 0.07% a year and says it is included in the "enhanced return", not charged separately. It does not explain more, and I will not guess. If a gap surprises you, open the prospectus or the KID and look for the explanation. Also remember that a past gap is not a promise, and that this fund carries the counterparty risk from Part 2.
justETF lists failing to track the index as closely as rivals do as a red flag, and it means a persistent gap, not short-term noise [justETF, Red Flags]. So the question to ask is simple: compared with similar funds, is the gap steady and small?
Spread and Premium: The Costs of Trading an ETF
An ETF trades on an exchange like a share, so it has a market price. The SEC says this price "typically will be more or less than the fund's NAV per share". Shares priced above NAV "sell at a premium", and shares priced below it "sell at a discount". The bid-ask spread is "a hidden cost to investors since spreads reduce potential returns", and more liquid ETFs with higher trading volume typically have tighter spreads [SEC, ETFs].
A hypothetical example. An ETF shows a buy price of 20.00 and a sell price of 19.98. If you buy and immediately sell, you lose 0.02, which is 0.10% of 20.00. That is the spread. For a long-term investor who trades a few times a year, it is a small cost. For someone who trades often, it adds up. Your broker's screen shows both prices, so you can check before you trade.
Compare Two Funds Side by Side
The best way to learn is to put two documents next to each other. Below are two funds from earlier parts, with data from their factsheets dated 31 August 2026 [Vanguard factsheet], [Invesco factsheet]. They do different jobs, so this is not a contest. The point is to see how different the answers can be.
QuestionVanguard FTSE All-World High Dividend Yield (Acc)Invesco S&P 500 (Acc)IndexFTSE All-World High Dividend YieldS&P 500How it copies the indexPhysical, representative sampleSynthetic (swaps)Ongoing charge0.29%0.05% (swap fee 0.07% is included in the return)Number of holdings2,364 stocksNot stated; the index has about 500 companiesLargest holdingJPMorgan Chase, 2.2%NVIDIA, 8.10%Largest sectorFinancials, 30.4%Information technology, 36.7% (31 July 2026)Largest countryUnited States, 40.1%United States, 99.8% (31 July 2026)Tracking figure printedNoNoDividendsAccumulatedAccumulated
What do you see? The first fund spreads money over thousands of companies in many countries. The second is cheaper and tracks a well-known index, but almost all of it is in one country and one sector leads. Neither is "better". They answer different questions, which is why Part 4 puts them in different buckets.
Use this checklist for any fund. It combines justETF's red flags [justETF, Red Flags] with the fields above. Item 6 is my own addition:
1) Do I understand what it holds and why? Funds with leverage or short positions can behave in unexpected ways, so avoid anything you cannot explain.
2) Is the cost fair for the same job? Compare funds that follow the same or a similar index.
3) Is the concentration acceptable? Check the top holdings, the largest sector, and the largest country.
4) Does it follow its index closely and steadily? Calculate the gap for several years.
5) Is key information easy to find? Missing information is a warning sign in itself.
6) Is it big enough and old enough? Very small, very new funds carry a higher chance of closure.
7) Does it still fit my plan? Sometimes it is best to simplify.
A Simple Yearly Routine
You do not need to watch your portfolio every day. FINRA says that "a yearly evaluation of your investments, at roughly the same time each year, is often enough", and that it helps you know "when your asset allocation has shifted and it's time to rebalance" [FINRA]. The SEC adds that rebalancing "tends to work best when done relatively infrequently" [Investor.gov]. Here is one routine built on those ideas. The steps are my suggestion, not a rule.
1) Pick one date, and put it in your calendar. Same time each year, as FINRA suggests.
2) Check the base. Is the emergency fund still enough for your life now? If not, fix that first.
3) Check the goal and the horizon. Did anything change: a job, a family, a plan to buy a home? A goal that is now closer may need a larger calm layer (Part 4).
4) Measure the mix. Calculate each bucket's share of the total. Compare it with your targets and write down the drift.
5) Rebalance, mostly with new money. Add to the buckets below target. Sell only when the drift is big and the costs and taxes are acceptable.
6) Open each fund's latest document. Has the ongoing charge changed? Is the fund still big enough? Is anything in the holdings or the index description different? Replace a fund only for a clear reason, because switching has costs.
7) Look at annualised return, not just the last year. FINRA says that to compare investments held for different periods, "the best way to compare their performance is by looking at their annualized percent return" [FINRA]. Compare it with the index, not with your friend's last trade.
8) Write a decision note. One short paragraph: what you checked, what you changed, and why. Next year you will not remember your reasons, and the note protects you from panic decisions.
9) Do nothing, on purpose, the rest of the year. Keep the automatic monthly investment running.
Taxes and Paperwork: Questions for Your Country
Part 3 and Part 4 showed that tax rules differ a lot: the same dividend can be taxed differently depending on the fund's domicile and your country's treaties. We do not try to give a general answer, because there is none. Instead, keep one folder with the documents of each year, and answer these questions for your country:
1) Who reports my income and gains to the tax office: me, or my broker?
2) How are dividends, interest, and gains taxed, and at what rates?
3) Does the fund's domicile change the tax withheld on dividends?
4) Which records must I keep, and for how many years?
5) Are there tax-advantaged accounts with limits and exit rules (Part 4)?
When the answers are unclear, a local licensed tax adviser is worth the fee.
Where the Series Ends
Five parts, one path. Here is the whole series in one table:
PartQuestion it answersMain idea1Why and what?Inflation, compounding, and the full map of tools.2How do I buy broad markets?Index funds, ETFs, brokers, ISINs, and costs.3What about safe money?Deposits, bonds, and how rules differ by country.4How do I combine them?Base, three questions, a mix, buckets, and rebalancing.5How do I check and run it?Read the documents, know the costs, follow a yearly routine.
Decide for Yourself
You now have the full chain: why to invest, which tools exist, how to hold them, how to combine them, how to read what you buy, and how to run it over the years. No part of this series knows your income, your goals, your family, or your fears. Use the structure, change the numbers, and read the official documents for your own country.
The best portfolio is one you understand, can afford to hold in a bad year, and can keep for decades. Start small, write your plan down while you are calm, and come back to it once a year.
Educational content only, not financial advice. The funds below are examples used to show how to read documents. They are not recommendations, and you may not be able to buy them in your country. Figures from fund documents are dated 31 August 2026 unless stated otherwise, and sources were checked in October 2026.
References
1) Key information documents for packaged retail and insurance-based investment products (PRIIPs), European Commission
2) PRIIPs KIDs: how to read them all, ESMA Report on Trends, Risks and Vulnerabilities No. 1, 2021
3) How to Read a Mutual Fund Prospectus (Part 2 of 3: Fee Table and Performance), US SEC, 13 June 2016
4) Updated Investor Bulletin: How to Read a Mutual Fund or ETF Shareholder Report, US SEC, 19 January 2024
5) Updated Investor Bulletin: Exchange-Traded Funds (ETFs), US SEC, 23 February 2023
6) Mutual Fund and ETF Fees and Expenses, US SEC Investor Bulletin, 23 July 2025
7) How Fees and Expenses Affect Your Investment Portfolio, US SEC Investor Bulletin, 23 July 2025
8) Evaluating Performance, FINRA
9) Asset Allocation, Investor.gov (US SEC)
10) Cost of ETFs: Total Expense Ratio (TER) vs. Total Cost of Ownership (TCO), Petra Riedl, justETF, 7 July 2023 (published by an ETF information site)
11) Tracking-Differenz vs. Tracking-Error, Tobias Reger, justETF, 14 January 2026 (in German)
12) ETF Red Flags, justETF, 12 December 2024
13) Vanguard FTSE All-World High Dividend Yield UCITS ETF (USD) Accumulating, factsheet, Vanguard, 31 August 2026
14) Invesco S&P 500 UCITS ETF Acc, factsheet, Invesco, 31 August 2026
15) Vanguard FTSE All-World UCITS ETF (USD) Accumulating, Key Investor Information, Vanguard, 28 July 2026